Usage Funnel (Codecademy Project)
This project analyzes the different Warby Parker's Marketing Funnel in order to calculate conversion rates.
Warby Parker is a transformative lifestyle brand with a lofty objective: to offer designer eyewear at a revolutionary price while leading the way for socially conscious businesses. Founded in 2010 and named after two characters in an early Jack Kerouac journal, Warby Parker believes in creative thinking, smart design, and doing good in the world. For every pair of eyeglasses and sunglasses sold, a pair is distributed to someone in need.
To help users find their perfect frame, Warby Parker has a Style Quiz that has the following questions: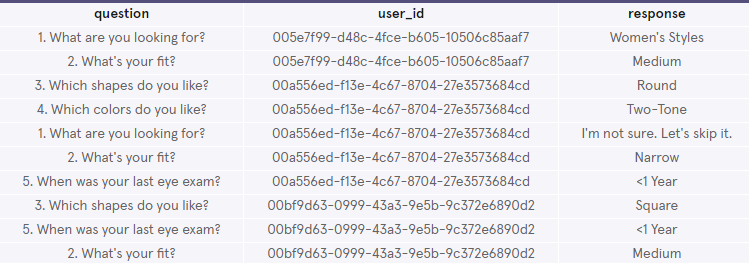
Users will “give up” at different points in the survey.Let’s analyze how many users move from Question 1 to Question 2, etc. Create a quiz funnel using the GROUP BY command.
What is the number of responses for each question?
Let's use this query.
We then get this result,
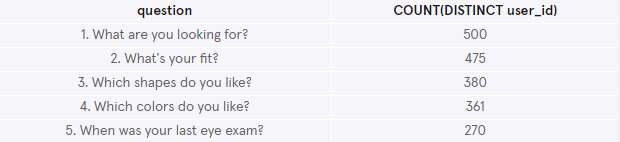
As we can see, out of 500 users who started the survey, only 270 people actually completed the survey.
Using a spreadsheet program like Excel or Google Sheets, let's calculate the percentage of users who answer each question:
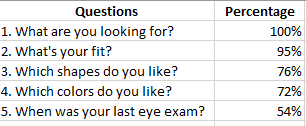
The 5th question has the lowest servey answers. The reason could be because they forgot their last exam or did not have an eye exam prior to purchase.
Warby Parker's purchase funnel is:
Take the Style Quiz → Home Try-On → Purchase the Perfect Pair of Glasses
During the Home Try-On stage, we will be conducting an A/B Test:
Let's find out whether or not users who get more pairs to try on at home will be more likely to make a purchase.
Let's run this query.
And we get this result,
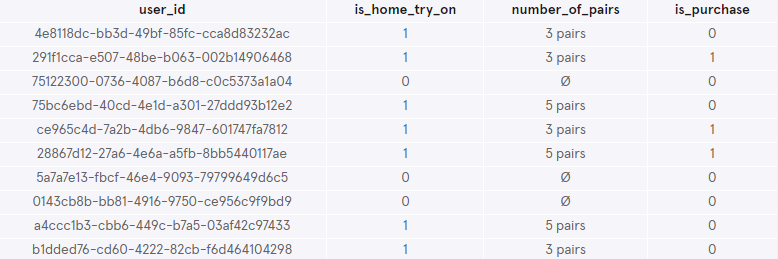
Now that we have this data, we can now analyze whether or not users who get more pairs to try on at home will be more likely to make a purchase.
Let's run another query.
This gives us this result.
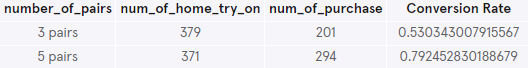
The results show that users who have 5 pairs of home try on are more likely to purchase with purchase percentage of 79% compared to 3 pairs with only 53%.
Let's find out which style and model is the most purchased.

Women's Styles has the most number of purchase totaling 252, although it is not that much difference compared to Men's Style with 243 total purchase.
Eugene Narrow and Dawes has the most number of purchase for Women's and Men's style, respectively.
Show Entire Code
To help users find their perfect frame, Warby Parker has a Style Quiz that has the following questions:
- What are you looking for?
- What's your fit?
- Which shapes do you like?
- Which colors do you like?
- When was your last eye exam?
Users will “give up” at different points in the survey.Let’s analyze how many users move from Question 1 to Question 2, etc. Create a quiz funnel using the GROUP BY command.
What is the number of responses for each question?
Let's use this query.
SELECT question,
COUNT(DISTINCT user_id)
FROM survey
GROUP BY question;
COUNT(DISTINCT user_id)
FROM survey
GROUP BY question;
We then get this result,
As we can see, out of 500 users who started the survey, only 270 people actually completed the survey.
Using a spreadsheet program like Excel or Google Sheets, let's calculate the percentage of users who answer each question:
- Which question(s) of the quiz have a lower completion rates?
- What do you think is the reason?
The 5th question has the lowest servey answers. The reason could be because they forgot their last exam or did not have an eye exam prior to purchase.
Warby Parker's purchase funnel is:
Take the Style Quiz → Home Try-On → Purchase the Perfect Pair of Glasses
During the Home Try-On stage, we will be conducting an A/B Test:
- 50% of the users will get 3 pairs to try on
- 50% of the users will get 5 pairs to try on
Let's find out whether or not users who get more pairs to try on at home will be more likely to make a purchase.
Let's run this query.
SELECT DISTINCT quiz.user_id,
h.number_of_pairs IS NOT NULL AS 'is_home_try_on',
h.number_of_pairs, p.user_id IS NOT NULL AS 'is_purchase'
FROM quiz
LEFT JOIN home_try_on AS 'h'
ON quiz.user_id = h.user_id
LEFT JOIN purchase AS 'p'
ON h.user_id = p.user_id
LIMIT 10;
h.number_of_pairs IS NOT NULL AS 'is_home_try_on',
h.number_of_pairs, p.user_id IS NOT NULL AS 'is_purchase'
FROM quiz
LEFT JOIN home_try_on AS 'h'
ON quiz.user_id = h.user_id
LEFT JOIN purchase AS 'p'
ON h.user_id = p.user_id
LIMIT 10;
And we get this result,
Now that we have this data, we can now analyze whether or not users who get more pairs to try on at home will be more likely to make a purchase.
Let's run another query.
WITH funnel AS (SELECT DISTINCT quiz.user_id,
h.number_of_pairs IS NOT NULL AS 'is_home_try_on',
h.number_of_pairs,
p.user_id IS NOT NULL AS 'is_purchase'
FROM quiz
LEFT JOIN home_try_on AS 'h'
ON quiz.user_id = h.user_id
LEFT JOIN purchase AS 'p'
ON h.user_id = p.user_id)
SELECT funnel.number_of_pairs,
SUM(is_home_try_on) AS 'num_of_home_try_on',
SUM(is_purchase) AS 'num_of_purchase',
1.0 * SUM(is_purchase)/SUM(is_home_try_on) AS 'Conversion Rate'
FROM funnel
WHERE funnel.number_of_pairs IS NOT NULL
GROUP BY 1;
This gives us this result.
The results show that users who have 5 pairs of home try on are more likely to purchase with purchase percentage of 79% compared to 3 pairs with only 53%.
Let's find out which style and model is the most purchased.
SELECT style, COUNT(*)
FROM purchase
GROUP BY 1;
SELECT style, model_name, COUNT(*)
FROM purchase
GROUP BY 2
ORDER BY 3 DESC;
FROM purchase
GROUP BY 1;
SELECT style, model_name, COUNT(*)
FROM purchase
GROUP BY 2
ORDER BY 3 DESC;
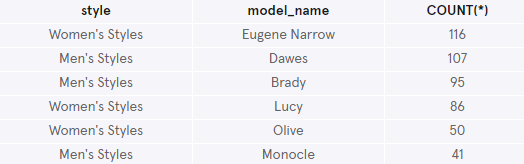
Women's Styles has the most number of purchase totaling 252, although it is not that much difference compared to Men's Style with 243 total purchase.
Eugene Narrow and Dawes has the most number of purchase for Women's and Men's style, respectively.
Show Entire Code
User Churn (Codecademy Project)
Codeflix, a streaming video startup, is interested in measuring their user churn rate. In this project, we'll be helping them answer these questions about their churn:
First, let's determine the range of months of data provided.
Let's run this query.
We'll be calculating the churn rate for both segments (87 and 30) over the first 3 months of 2017 (we can't calculate it for December, since there are no subscription_end values yet).

To get started, create a temporary table of months.
This is what our temporary table looks like.
We will then join this with our existing table subscriptions.
This is the joined table looks like. The subscriptions table on the left, two more columns added for the months.
Let's check the active users for segments 87 and 30 by creating another temporary table. We'll also create one for cancelled subscriptions for both segment.
Here's the result for this query,
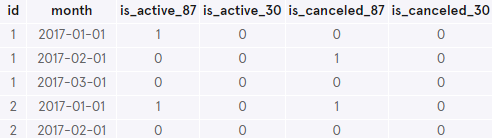
0 means false AND 1 means true. This will be useful later in calculating the churn rate.
Let's create another temporary table to calculate the SUM of active and canceled subscriptions for each segment, for each month.
It's now time to find out their churn rates.
Here's the result.
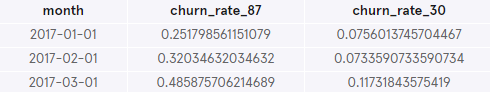
Segment 30 has the lowest churn rates for the first three months. That means less people are unsubscribing and that is better because that's how we generate sales. We want people to continue their subscription.
Show Entire Code
- How many months has the company been operating?
- Which months do you have enough information to calculate a churn rate?
- What segments of users exist?
- What is the overall churn trend since the company started?
- Which segment of users should the company focus on expanding?
First, let's determine the range of months of data provided.
Let's run this query.
SELECT MIN(subscription_start), MAX(subscription_end)
FROM subscriptions;
FROM subscriptions;
We'll be calculating the churn rate for both segments (87 and 30) over the first 3 months of 2017 (we can't calculate it for December, since there are no subscription_end values yet).
To get started, create a temporary table of months.
WITH months AS (
SELECT
'2017-01-01' AS first_day,
'2017-01-31' AS last_day
UNION
SELECT
'2017-02-01' AS first_day,
'2017-02-29' AS last_day
UNION
SELECT
'2017-03-01' AS first_day,
'2017-03-31' AS last_day
)
SELECT *
FROM months;
SELECT
'2017-01-01' AS first_day,
'2017-01-31' AS last_day
UNION
SELECT
'2017-02-01' AS first_day,
'2017-02-29' AS last_day
UNION
SELECT
'2017-03-01' AS first_day,
'2017-03-31' AS last_day
)
SELECT *
FROM months;
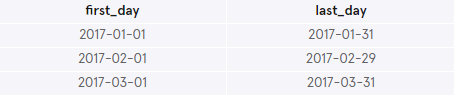
This is what our temporary table looks like.
We will then join this with our existing table subscriptions.
WITH months AS (
...
),
cross_join AS (
SELECT *
FROM subscriptions
CROSS JOIN months
)
SELECT *
FROM cross_join
LIMIT 5;
...
),
cross_join AS (
SELECT *
FROM subscriptions
CROSS JOIN months
)
SELECT *
FROM cross_join
LIMIT 5;
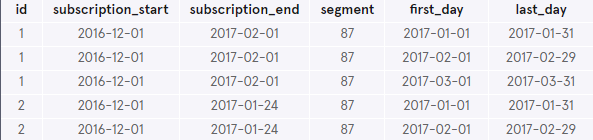
This is the joined table looks like. The subscriptions table on the left, two more columns added for the months.
Let's check the active users for segments 87 and 30 by creating another temporary table. We'll also create one for cancelled subscriptions for both segment.
WITH months AS (
...
),
cross_join AS (
...
),
status AS (
SELECT id,
first_day AS month,
CASE
WHEN (segment = 87
AND (subscription_start < first_day)
AND(subscription_end > first_day
OR subscription_end IS NULL)
) THEN 1
ELSE 0
END AS is_active_87,
CASE
WHEN (segment = 30
AND (subscription_start < first_day)
AND(subscription_end > first_day
OR subscription_end IS NULL)
) THEN 1
ELSE 0
END AS is_active_30,
CASE
WHEN (segment = 87
AND (subscription_end BETWEEN first_day
AND last_day)) THEN 1
ELSE 0
END AS is_canceled_87,
CASE
WHEN (segment = 30
AND (subscription_end BETWEEN first_day
AND last_day)) THEN 1
ELSE 0
END AS is_canceled_30
FROM cross_join
)
SELECT *
FROM status
LIMIT 5;
...
),
cross_join AS (
...
),
status AS (
SELECT id,
first_day AS month,
CASE
WHEN (segment = 87
AND (subscription_start < first_day)
AND(subscription_end > first_day
OR subscription_end IS NULL)
) THEN 1
ELSE 0
END AS is_active_87,
CASE
WHEN (segment = 30
AND (subscription_start < first_day)
AND(subscription_end > first_day
OR subscription_end IS NULL)
) THEN 1
ELSE 0
END AS is_active_30,
CASE
WHEN (segment = 87
AND (subscription_end BETWEEN first_day
AND last_day)) THEN 1
ELSE 0
END AS is_canceled_87,
CASE
WHEN (segment = 30
AND (subscription_end BETWEEN first_day
AND last_day)) THEN 1
ELSE 0
END AS is_canceled_30
FROM cross_join
)
SELECT *
FROM status
LIMIT 5;
Here's the result for this query,
0 means false AND 1 means true. This will be useful later in calculating the churn rate.
Let's create another temporary table to calculate the SUM of active and canceled subscriptions for each segment, for each month.
WITH months AS (
...
),
cross_join AS (
... ),
status AS (
...
)
status_aggregate AS(
SELECT month,
SUM(is_active_87) AS sum_active_87,
SUM(is_active_30) AS sum_active_30,
SUM(is_canceled_87) AS sum_canceled_87,
SUM(is_canceled_30) AS sum_canceled_30
FROM status
GROUP BY month
)
cross_join AS (
... ),
status AS (
...
)
status_aggregate AS(
SELECT month,
SUM(is_active_87) AS sum_active_87,
SUM(is_active_30) AS sum_active_30,
SUM(is_canceled_87) AS sum_canceled_87,
SUM(is_canceled_30) AS sum_canceled_30
FROM status
GROUP BY month
)
It's now time to find out their churn rates.
WITH months AS (
...
),
cross_join AS (
... ),
status AS (
...
)
status_aggregate AS(
...
)
SELECT month,
(1.0 * sum_canceled_87 / sum_active_87)
AS churn_rate_87,
(1.0 * sum_canceled_30 / sum_active_30)
AS churn_rate_30
FROM status_aggregate;
cross_join AS (
... ),
status AS (
...
)
status_aggregate AS(
...
)
SELECT month,
(1.0 * sum_canceled_87 / sum_active_87)
AS churn_rate_87,
(1.0 * sum_canceled_30 / sum_active_30)
AS churn_rate_30
FROM status_aggregate;
Here's the result.
Segment 30 has the lowest churn rates for the first three months. That means less people are unsubscribing and that is better because that's how we generate sales. We want people to continue their subscription.
Show Entire Code
Marketing Attribution (Codecademy Project)
CoolTShirts, an innovative apparel shop, is running a bunch of marketing campaigns.
In this project, we'll be helping them answer these questions about their campaigns:
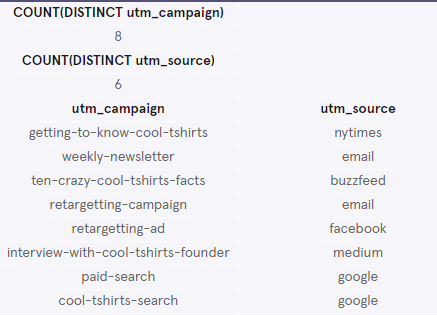
Let's first find out how many campaign and sources does CoolShirts use and which source is used for each campaign.
Let's run these queries.
This is what we get. There are 8 campaigns and 6 sources.
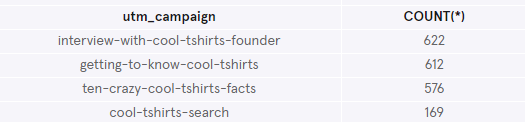
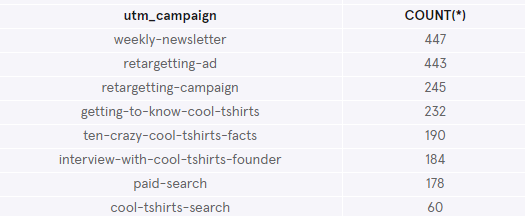
Let's find out how many first touches is each campaign responsible for.
Let's run this query.
interview-with-cool-tshirts-founder campaign has the highest first touch but this doesn't mean this same campaign made the users purchase the product. Let's find out more.
Now, let's check the last touches each campaign is responsible for. We'll use the same query and change first to last.
Let's run this query.
weekly-newsletter campaign has more last touches compared to the other campaigns.
Now, let' find out which campaign drives our visitors to purchase.
We'll just add this in our previous query.
weekly-newsletter campaign drives more visitors to purchase our products.
CoolTShirts can re-invest in 5 campaigns. Given our findings in the project, which should they pick and why?
CoolTShirt should re-invest in campaigns that generated more sales. On the other hand, it would be helpful if we also study the other campaigns that generated low purchase conversion and see what we can do to improve them.
Show Entire Code
In this project, we'll be helping them answer these questions about their campaigns:
- How many campaigns and sources does CoolTShirts use and how are they related?
- What pages are on their website?
- How many first touches is each campaign responsible for?
- How many last touches is each campaign responsible for?
- How many last touches on the purchase page is each campaign responsible for?
- CoolTShirts can re-invest in 5 campaigns. Which should they pick and why?
Let's first find out how many campaign and sources does CoolShirts use and which source is used for each campaign.
Let's run these queries.
SELECT COUNT(DISTINCT utm_campaign)
FROM page_visits;
SELECT COUNT(DISTINCT utm_source)
FROM page_visits;
SELECT DISTINCT utm_campaign, utm_source
FROM page_visits;
FROM page_visits;
SELECT COUNT(DISTINCT utm_source)
FROM page_visits;
SELECT DISTINCT utm_campaign, utm_source
FROM page_visits;
This is what we get. There are 8 campaigns and 6 sources.
Let's find out how many first touches is each campaign responsible for.
Let's run this query.
WITH first_touch AS (
SELECT user_id,
MIN(timestamp) AS 'first_touch_at',utm_campaign
FROM page_visits
GROUP BY user_id)
SELECT first_touch.utm_campaign, COUNT(*)
FROM first_touch
GROUP BY 1 ORDER BY 2 DESC;
SELECT user_id,
MIN(timestamp) AS 'first_touch_at',utm_campaign
FROM page_visits
GROUP BY user_id)
SELECT first_touch.utm_campaign, COUNT(*)
FROM first_touch
GROUP BY 1 ORDER BY 2 DESC;
interview-with-cool-tshirts-founder campaign has the highest first touch but this doesn't mean this same campaign made the users purchase the product. Let's find out more.
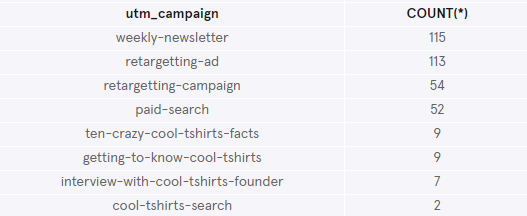
Now, let's check the last touches each campaign is responsible for. We'll use the same query and change first to last.
Let's run this query.
WITH last_touch AS (
SELECT user_id,
MAX(timestamp) AS 'last_touch_at',utm_campaign
FROM page_visits
GROUP BY user_id)
SELECT last_touch.utm_campaign, COUNT(*)
FROM last_touch
GROUP BY 1
ORDER BY 2 DESC;
SELECT user_id,
MAX(timestamp) AS 'last_touch_at',utm_campaign
FROM page_visits
GROUP BY user_id)
SELECT last_touch.utm_campaign, COUNT(*)
FROM last_touch
GROUP BY 1
ORDER BY 2 DESC;
weekly-newsletter campaign has more last touches compared to the other campaigns.
Now, let' find out which campaign drives our visitors to purchase.
We'll just add this in our previous query.
...
WHERE page_name = '4 - purchase'
...
WHERE page_name = '4 - purchase'
...
weekly-newsletter campaign drives more visitors to purchase our products.
CoolTShirts can re-invest in 5 campaigns. Given our findings in the project, which should they pick and why?
CoolTShirt should re-invest in campaigns that generated more sales. On the other hand, it would be helpful if we also study the other campaigns that generated low purchase conversion and see what we can do to improve them.
Show Entire Code